Network Latency: Best Tools for Measuring
Enterprise businesses such as banking business using latency sensitive applications. Most of application delay issues are related to network infrastructure. Also most of application server are Linux servers. How can we measure network latency on Linux?
What Do Most Administrators Do?
Applications administrators will do the below typically:
Ping <Destination IP>
Sending and receiving ICMP echo is good enough for test connectivity between a source and a destination. But has some limitations for measurement.
ICMP Limitations as Metric for Measurement
ICMP echo packets are often given second-class treatment by routers and target hosts. I’m saying that ICMP Echo Requests and Responses may be backed up behind traffic that is considered more important. And if resources are really at the point of starvation, then a router or target host is often more likely to dispose of a Ping than other kinds of traffic.
Is iPerf Good Enough?
IPerf is an utility for measuring bandwidth. So, when you are using IPerf, your result would be maximum achieved bandwidth and number of errors.
QPerf, Measure Both Network Bandwidth and Latency
Qperf is a benchmarking and diagnostic tool that is used to measure the performance of communication between two systems. It is primarily used to evaluate the latency (round-trip time) and bandwidth (throughput) between two endpoints.
Qperf operates by running tests that involve sending and receiving packets between the client and server systems. These tests can be customized to measure specific aspects of performance, such as TCP or UDP throughput, latency, packet loss, and CPU utilization.
The tool provides various metrics and statistics that help assess performance, including round-trip time (RTT), throughput (in bytes per second), jitter, and packet loss. It can be used to compare different configurations, identify bottlenecks, and troubleshoot performance issues.
Qperf is commonly used in research, system administration, and performance optimization. It is available for various operating systems, including Linux, Unix-like systems, and Windows.
Here are some key features and aspects of Qperf:
- Benchmarking: Qperf is primarily used to benchmark performance. It helps measure metrics such as latency (round-trip time), bandwidth (throughput), packet loss, and jitter. These metrics provide insights into how efficiently data is transferred between systems.
- Client-Server Architecture: Qperf operates in a client-server architecture. The client initiates the tests by sending packets to the server, which then responds. By comparing the time, it takes for the packets to travel back and forth, Qperf calculates metrics like latency and throughput.
- Customizable Tests: Qperf offers flexibility in configuring the tests according to your specific requirements. You can customize parameters such as packet size, test duration, number of parallel streams, and protocol (TCP or UDP). This allows you to simulate different scenarios and assess network performance under various conditions.
- Metrics and Statistics: Qperf provides detailed metrics and statistics about performance. It reports round-trip time (RTT) in milliseconds, throughput in bytes per second (bps), jitter, and packet loss percentage. These measurements help identify potential issues and analyze the efficiency of the connection.
- Diagnostic Capabilities: In addition to benchmarking, Qperf can be used for diagnostics. By examining the test results, you can identify potential bottlenecks, congestion, or configuration problems that may affect performance. This information is valuable for troubleshooting and optimizing network setups.
- Platform Availability: Qperf is available for various operating systems, including Linux, Unix-like systems (such as FreeBSD), and Windows. It can be installed and executed from the command line, making it accessible for administrators, researchers, and performance analysts.
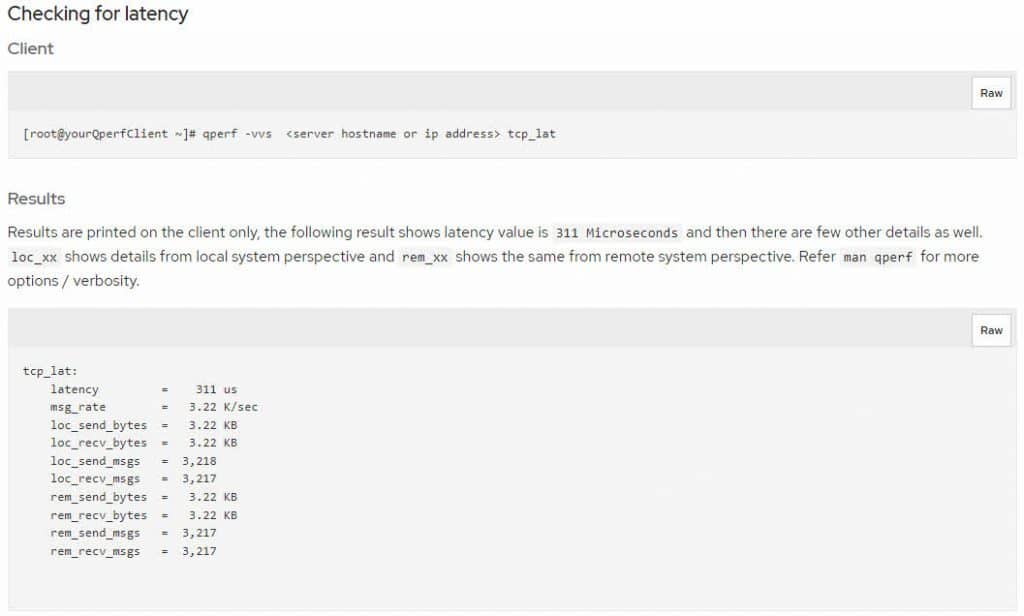
Qperf Usage Example
There are two nodes:
- Server: Receiving Data
- Client: Sending Data
Both server should have access to each other on TCP port: 19765

Further Reading
I/O Block Size Best Practice on EMC All Flash/Hybrid Flash Array and Linux (Physical And Virtual)
Backup 10 VMs For Free By Vembu BDR Suite Free Edition
Veeam Backup and Replication – How to Choose Best Transport Mode for vSphere Proxy?
External Links
How to use qperf to measure network bandwidth and latency performance? – Red Hat Customer Portal
iPerf – The TCP, UDP and SCTP network bandwidth measurement tool


